Property Management and Real Estate PowerPoint Template
October 10, 2026 by Ryan
What It Is
This is a 13-slide, fully editable PowerPoint template built for property management groups, real estate developers, and state-owned city-space operators that need to present annual results, portfolio performance, and investor updates with industry-native credibility. It was modelled on the annual results deck of a real Shenzhen-listed state-owned urban operator — a group operating since 1982 and listed since 1992 — so every layout reflects how these businesses actually report: area under management, segment revenue mix, the gross-margin gap between services and development, inventory-heavy balance sheets, land value-added tax settlements, and the distance between recognised profit and collected cash.
The visual identity is a dark architectural theme — a deep navy canvas with drafting hairlines, a confident blue primary, and a single amber highlight that always marks the current reporting year, with a muted rust reserved for negatives. Georgia carries the assertion-style headlines, Segoe UI handles the prose, and Consolas keeps every figure tabular and legible on a projector. Two atmospheric visuals carry the narrative: a full-bleed city skyline on the cover and a blueprint-style scene on the outlook page, while the remaining eleven slides are disciplined, chart-first information design.
Everything is native PowerPoint. All ten charts are real, editable chart objects — including a genuine waterfall chart for the cash bridge — not flattened images. Every icon is a vector shape, and the palette, fonts, and layouts can be restyled in minutes. Replace the figures with your own, retitle the sections, and the deck is presentation-ready the same day.
What’s Inside
The 13 slides follow a proven narrative arc — Platform → Performance → Earnings Quality → Cash → Forward — designed for asset-heavy operators:
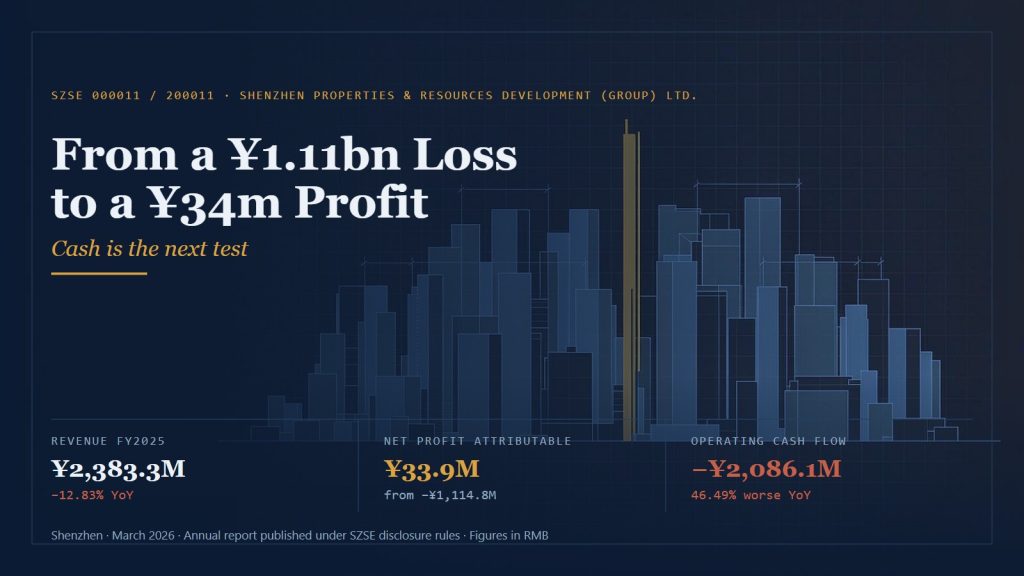
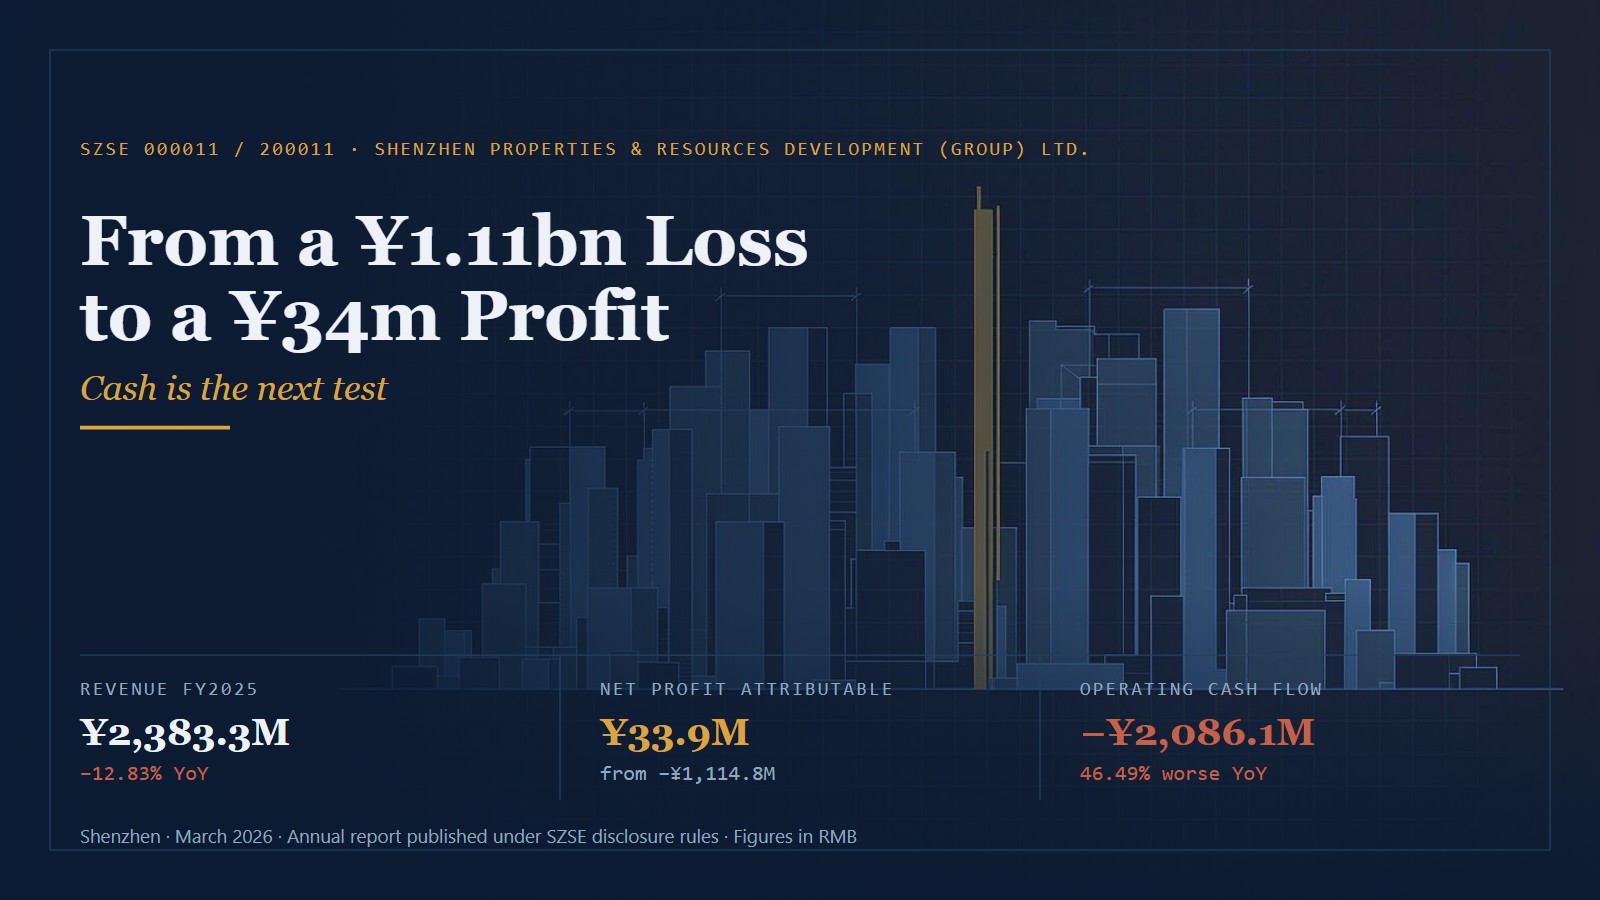
- Cover slide — a full-bleed skyline visual with the headline result and three KPIs (revenue, net profit, operating cash flow), each with its year-on-year delta.
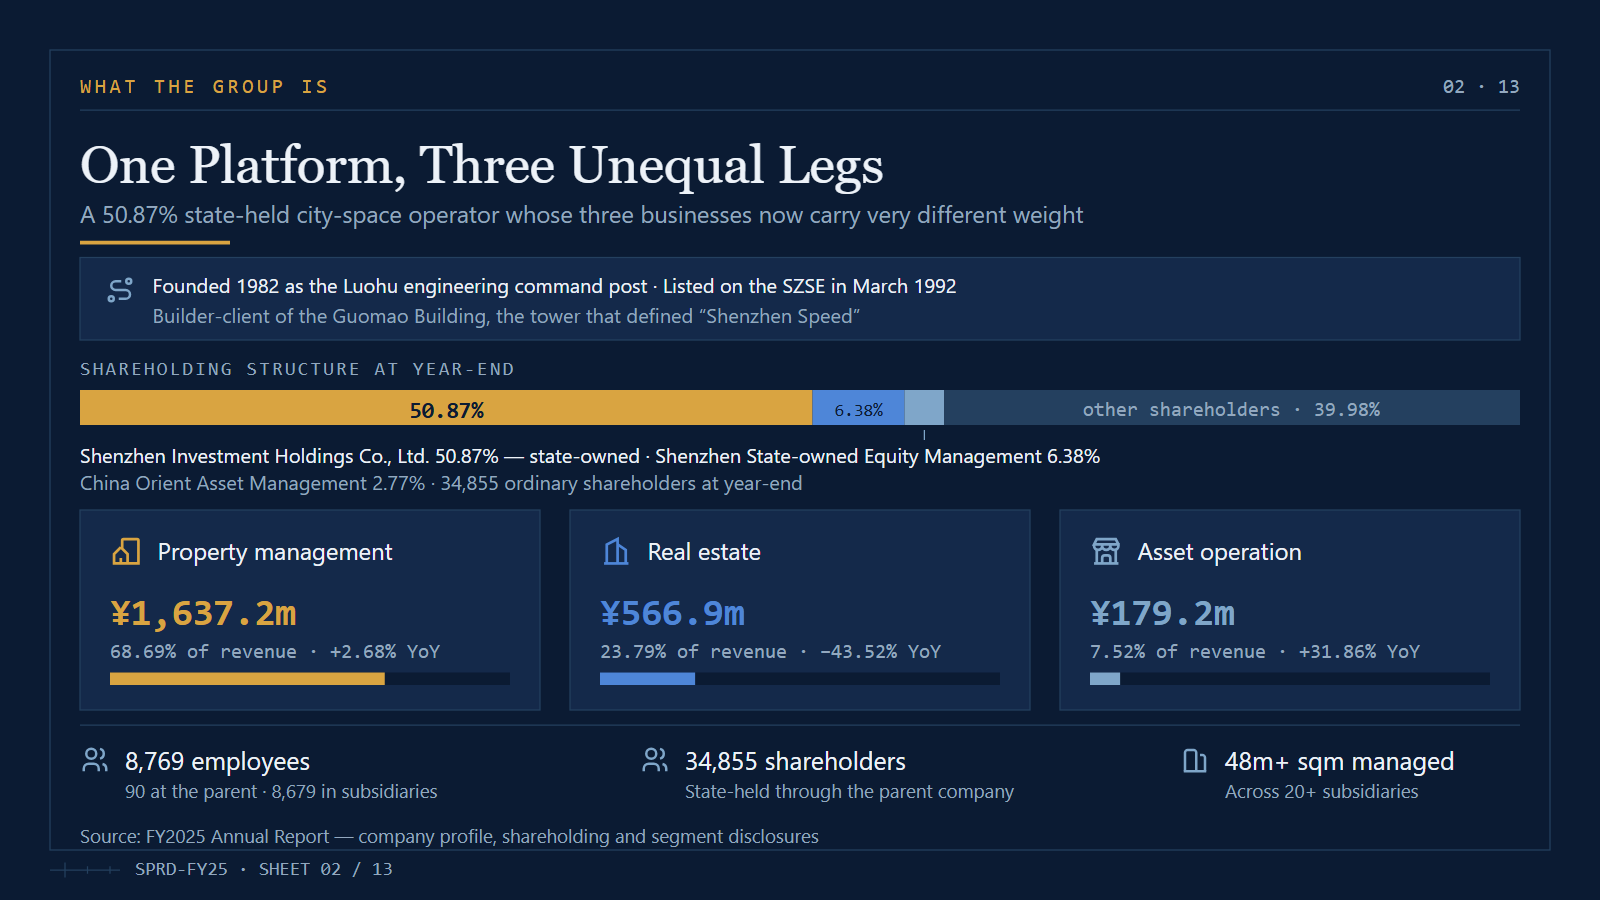
- Business platform slide — a three-legged revenue map (property management, real estate, asset operation) with shareholding structure, headcount, shareholder count, and area under management callouts — ideal for multi-segment city operators.
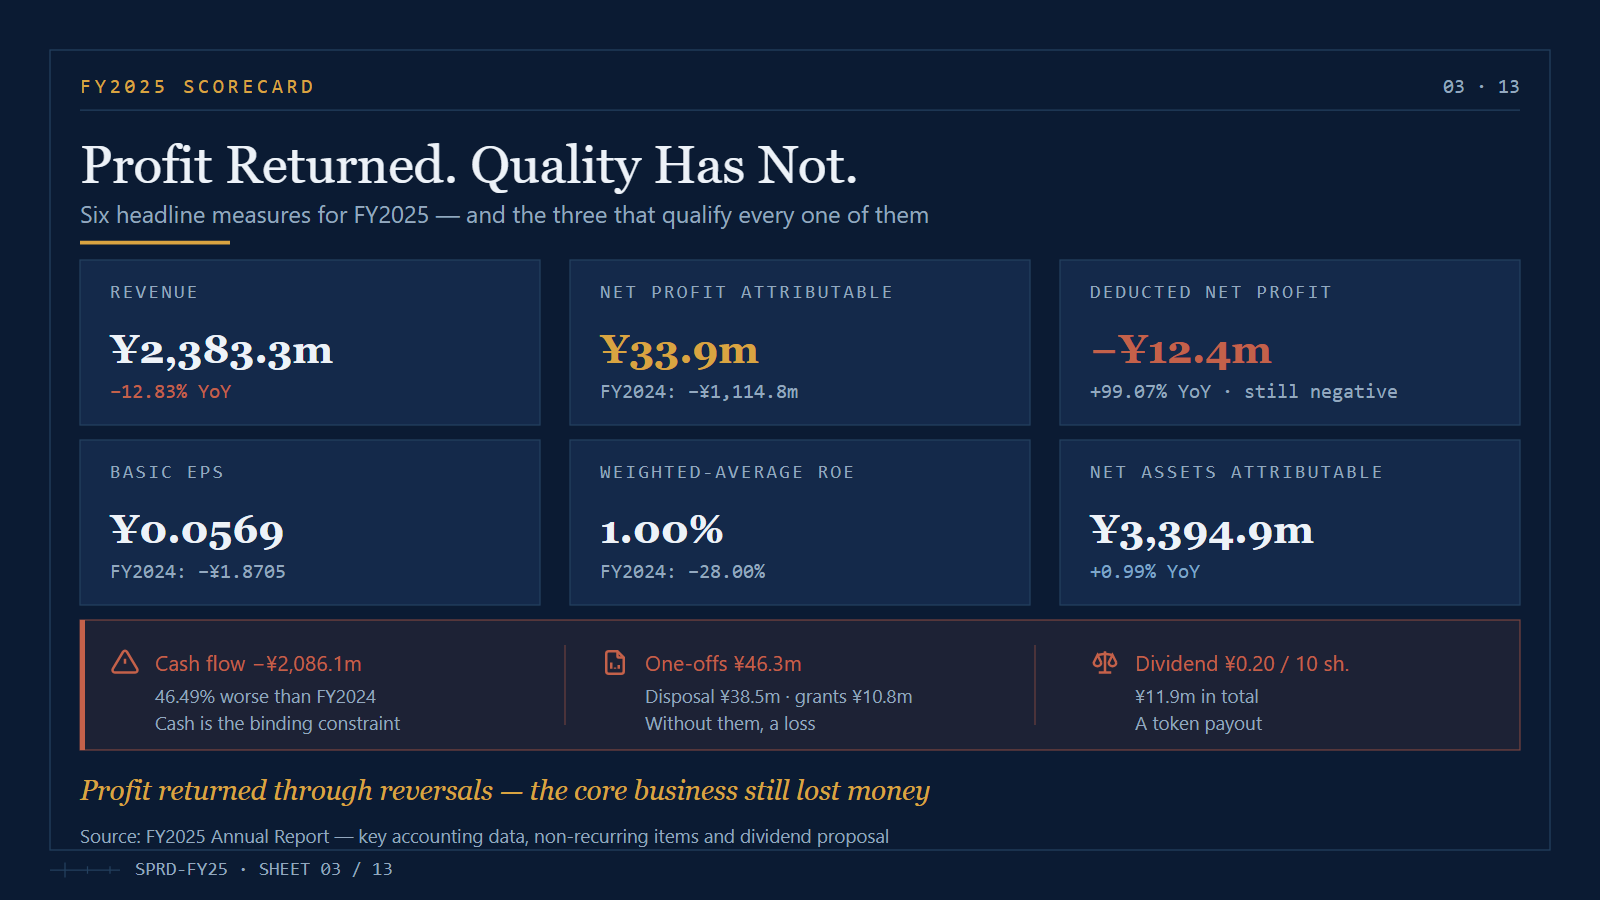
- Results scorecard — six headline measures (revenue, net profit, deducted net profit, EPS, weighted-average ROE, net assets) each paired with the prior-year comparison, plus a three-strip alert row covering cash flow, one-off items, and dividend policy.
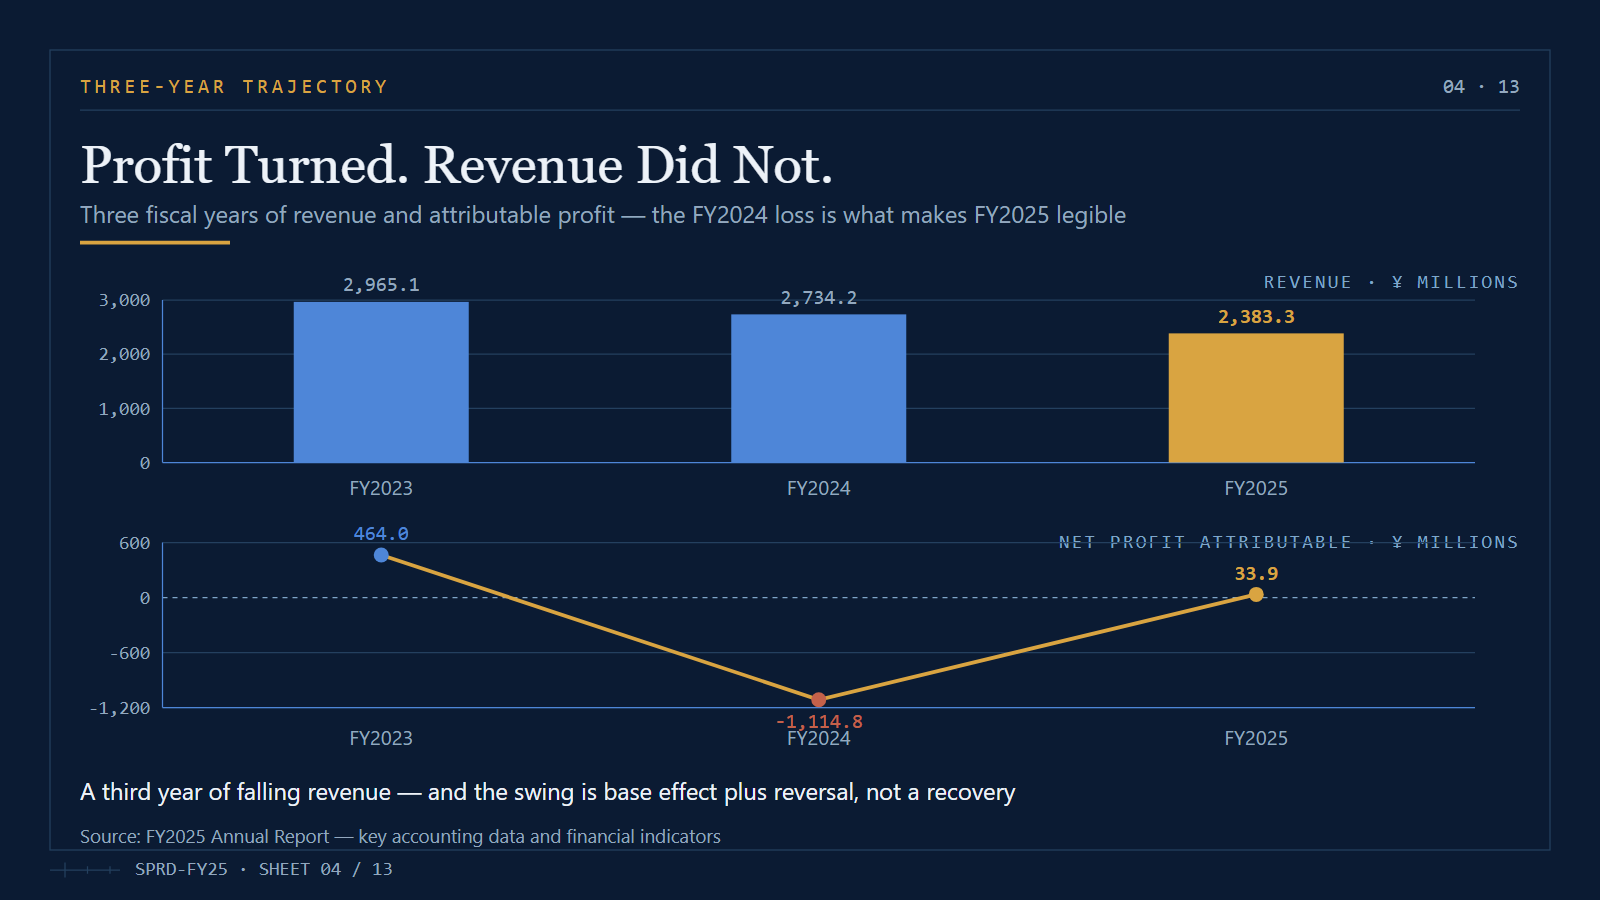
- Three-year trajectory — a column chart of revenue paired with a line chart of attributable profit, so a loss-to-profit swing reads honestly next to a declining topline.
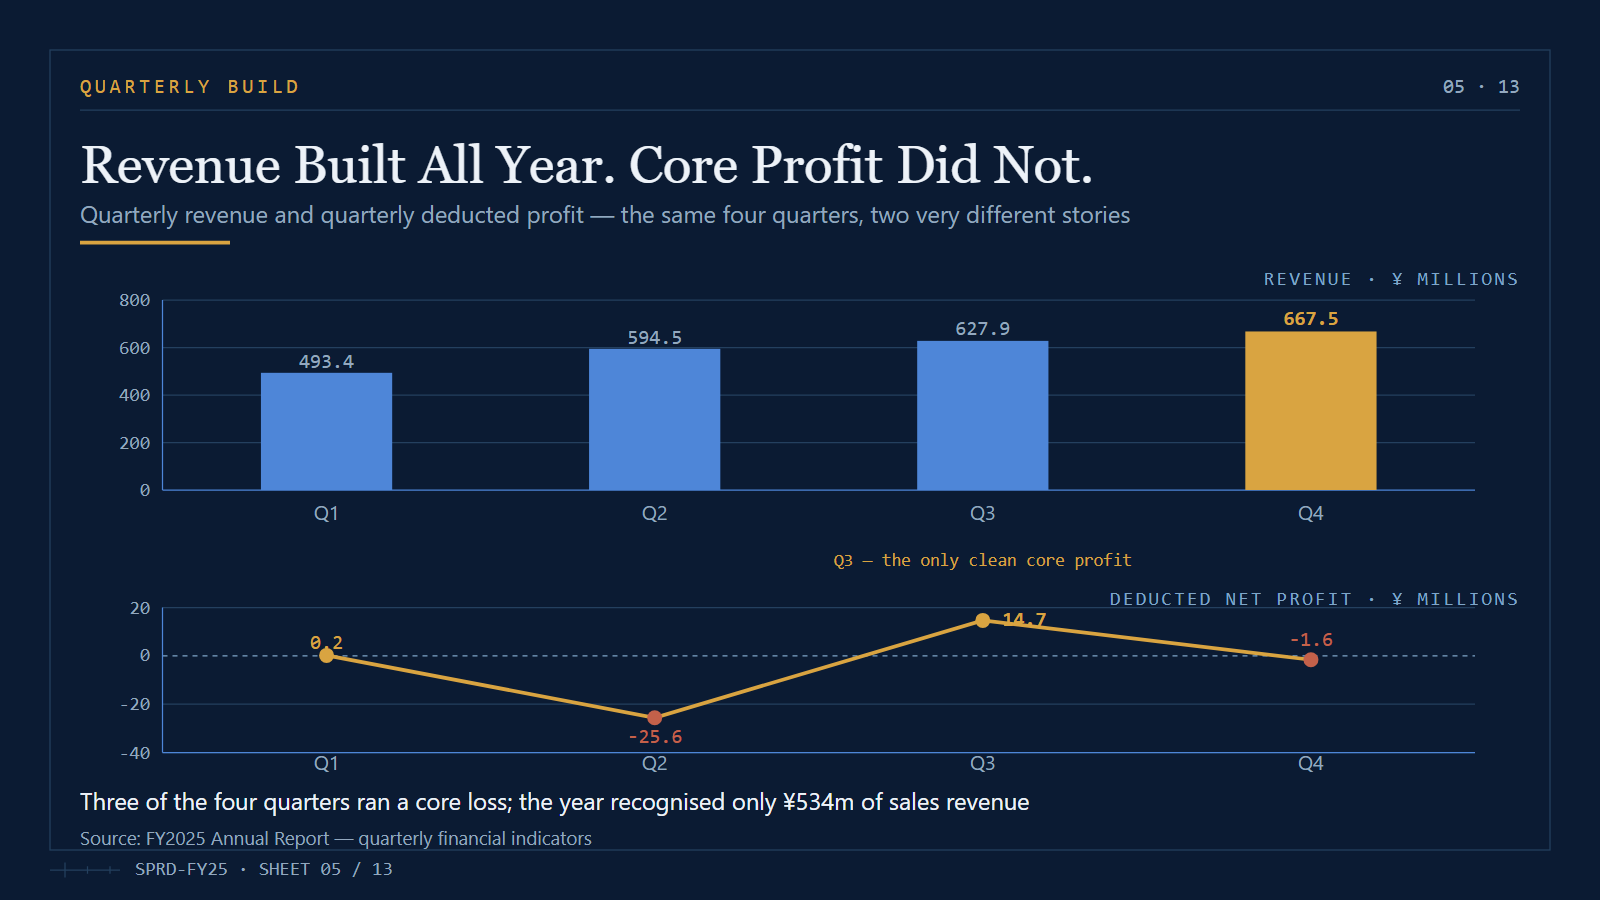
- Quarterly build — quarterly revenue columns against a quarterly deducted-profit line, with an annotation marking the one clean quarter. The most useful slide in the deck for spotting recognition timing.
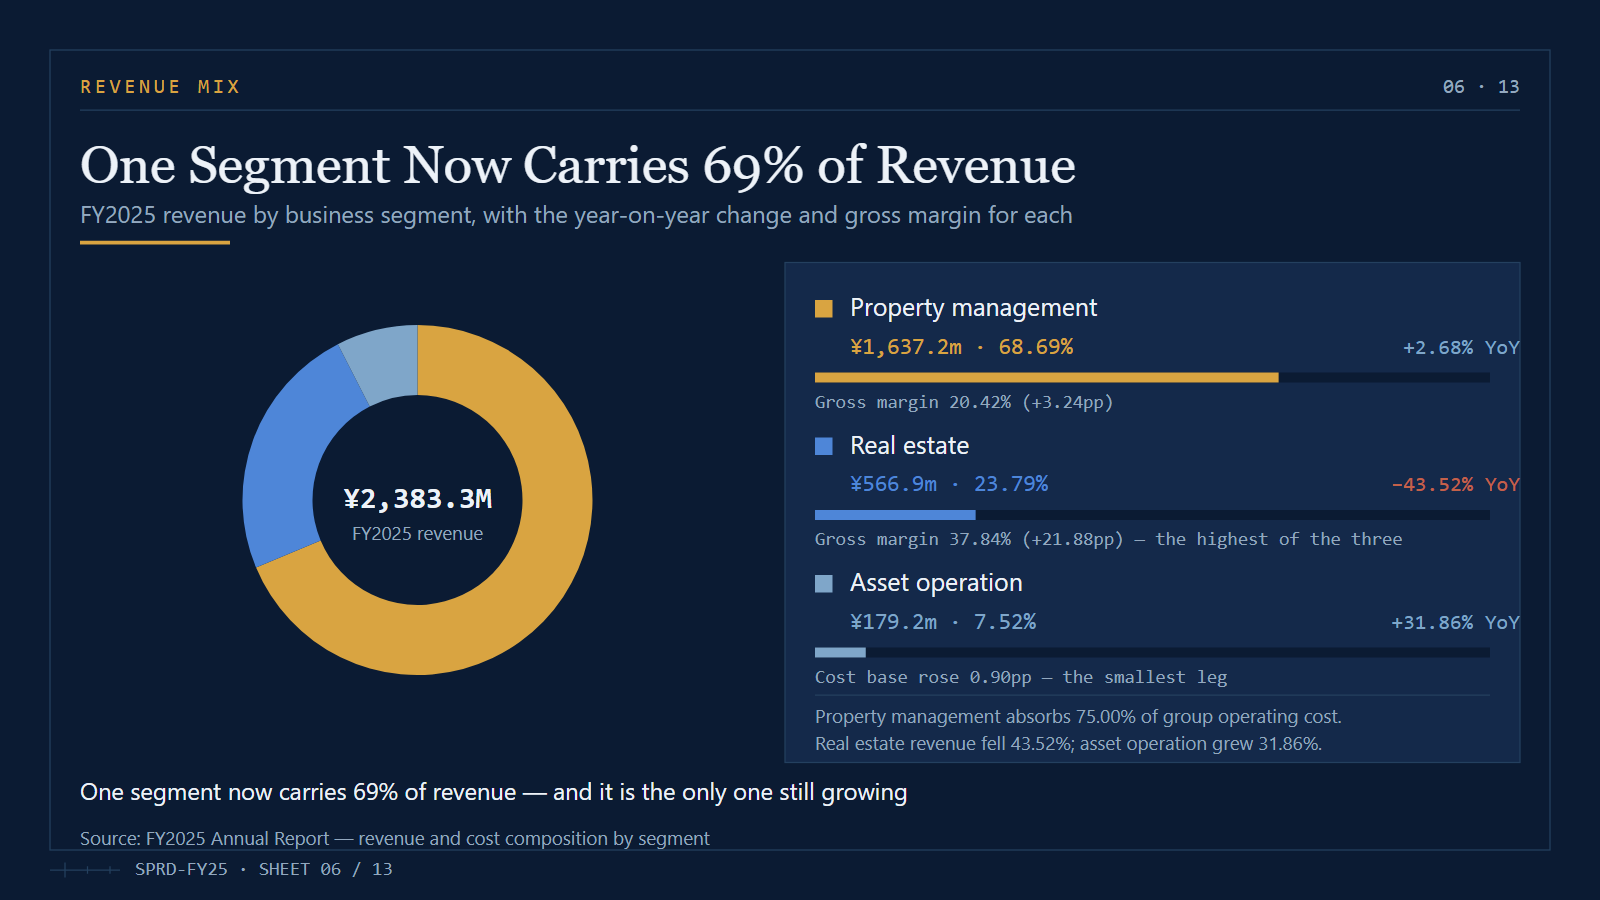
- Revenue mix — a doughnut of segment revenue with three companion panels giving each segment’s share, year-on-year change, and gross margin.
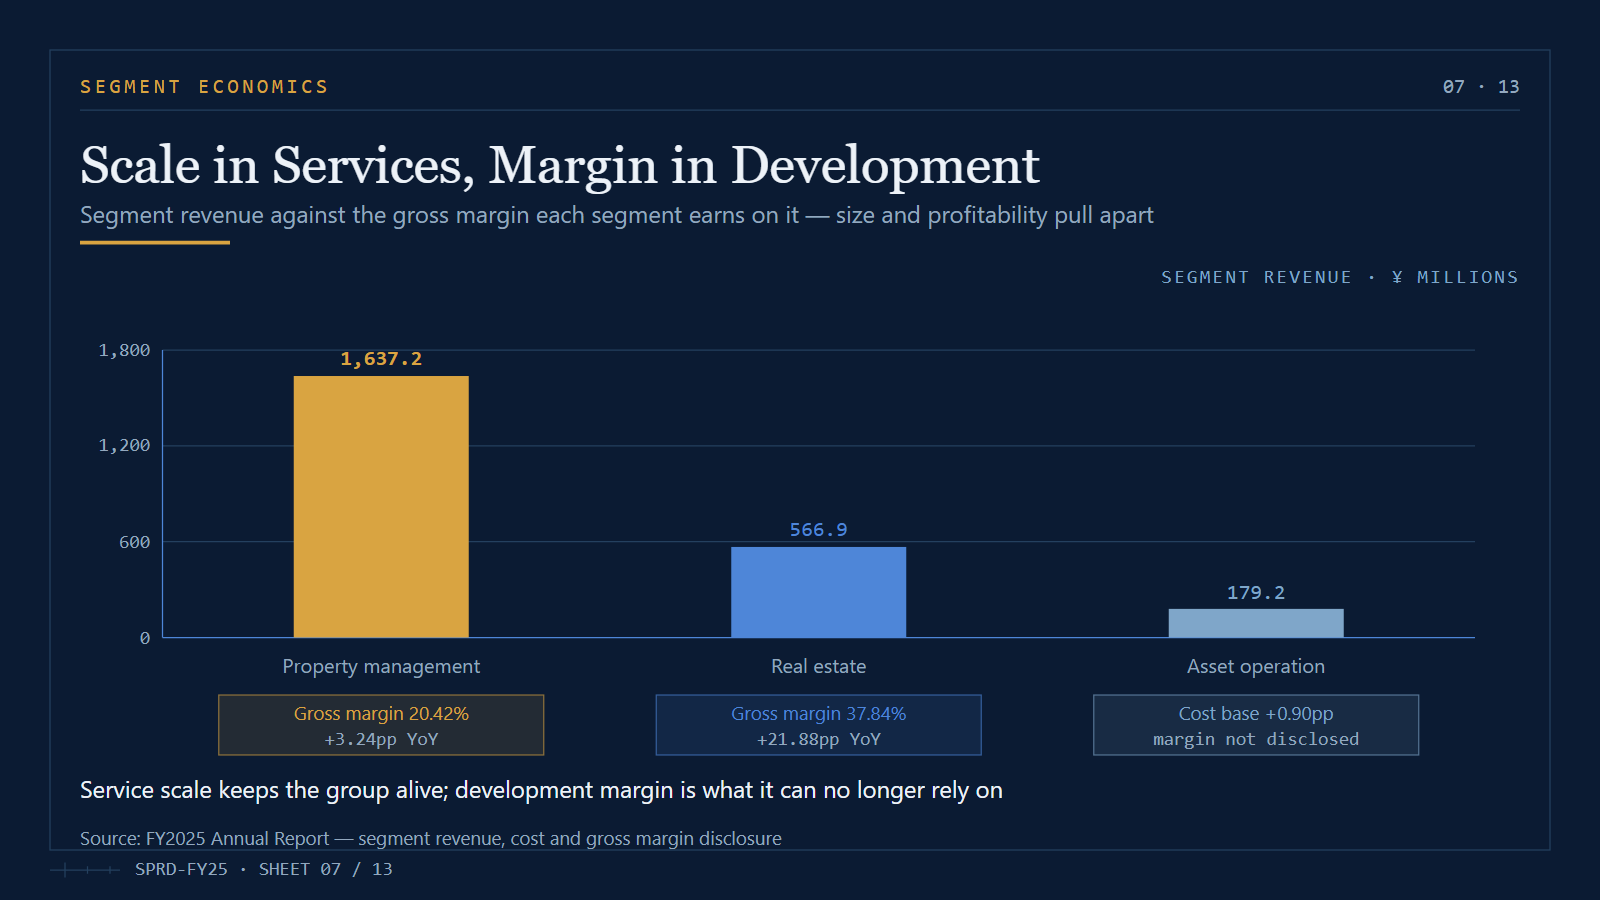
- Segment economics — segment revenue columns paired with gross-margin plates, showing scale and profitability pulling in opposite directions.
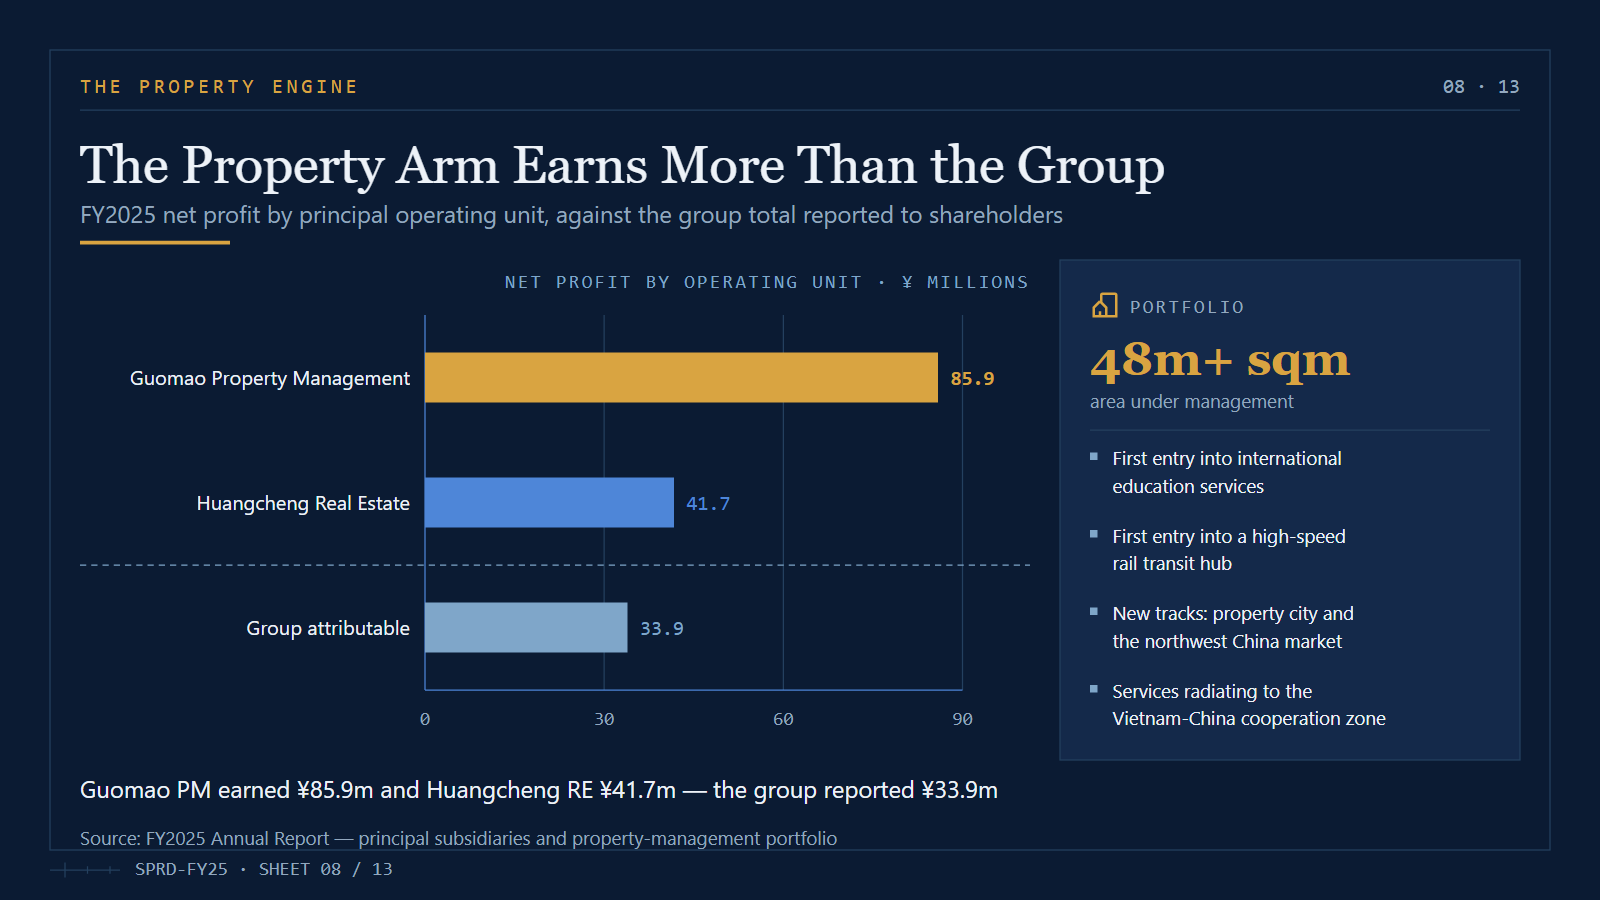
- Operating engine slide — a horizontal bar chart of net profit by principal subsidiary measured against the group total, plus a portfolio panel for area growth and new business lines.
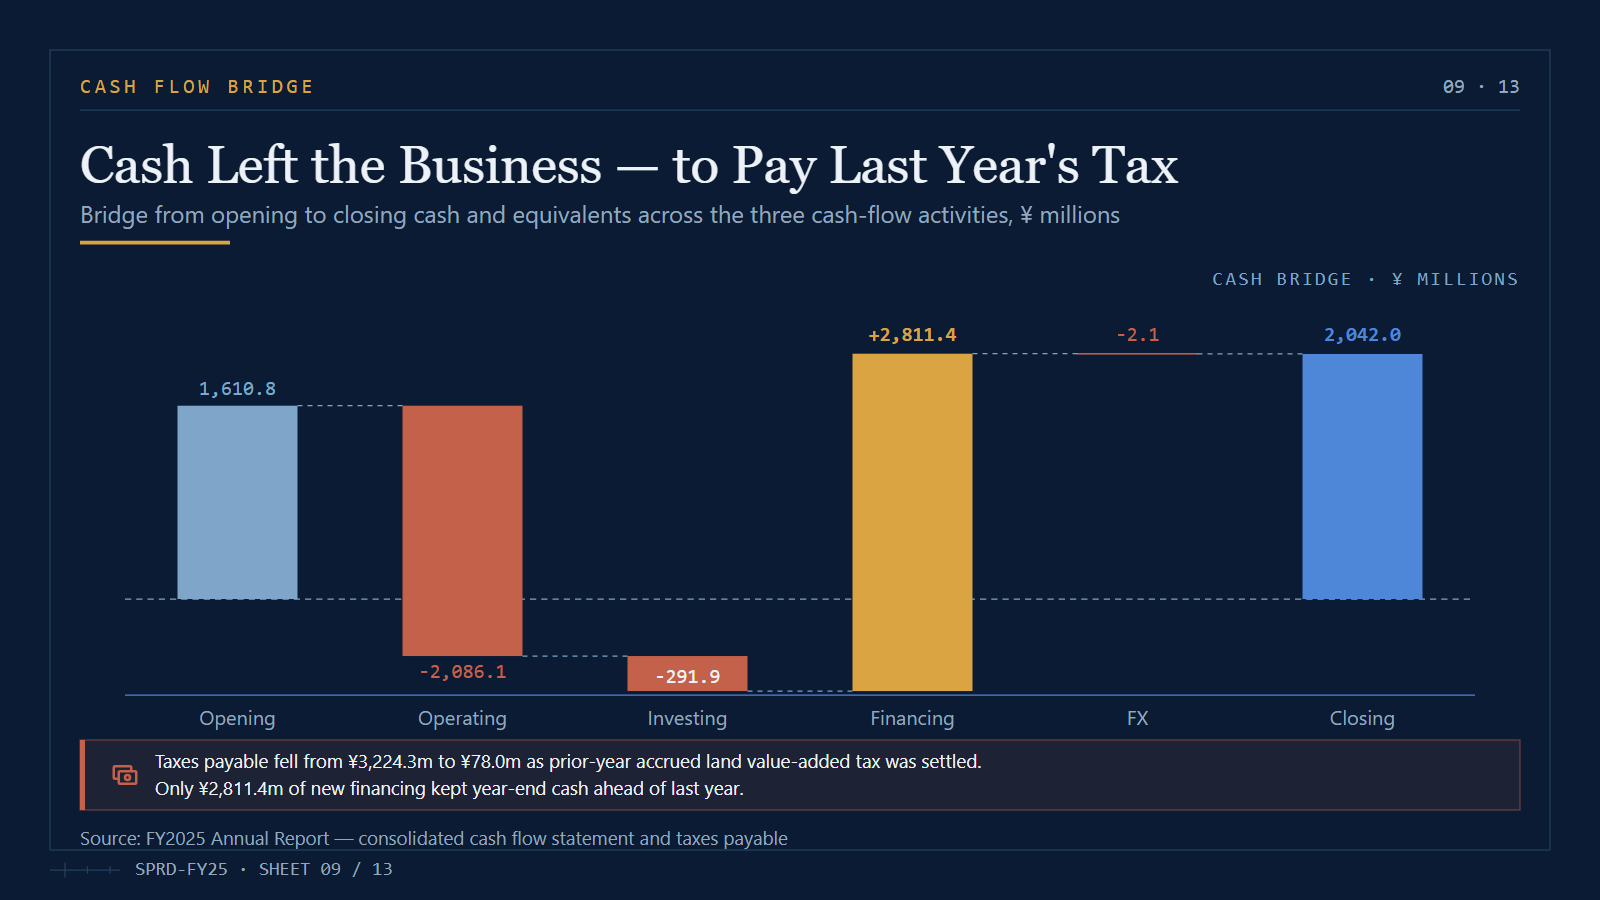
- Cash flow bridge — a native waterfall chart running from opening cash through operating, investing, financing, and FX to closing cash, annotated with the tax settlement and new borrowings that drove it.
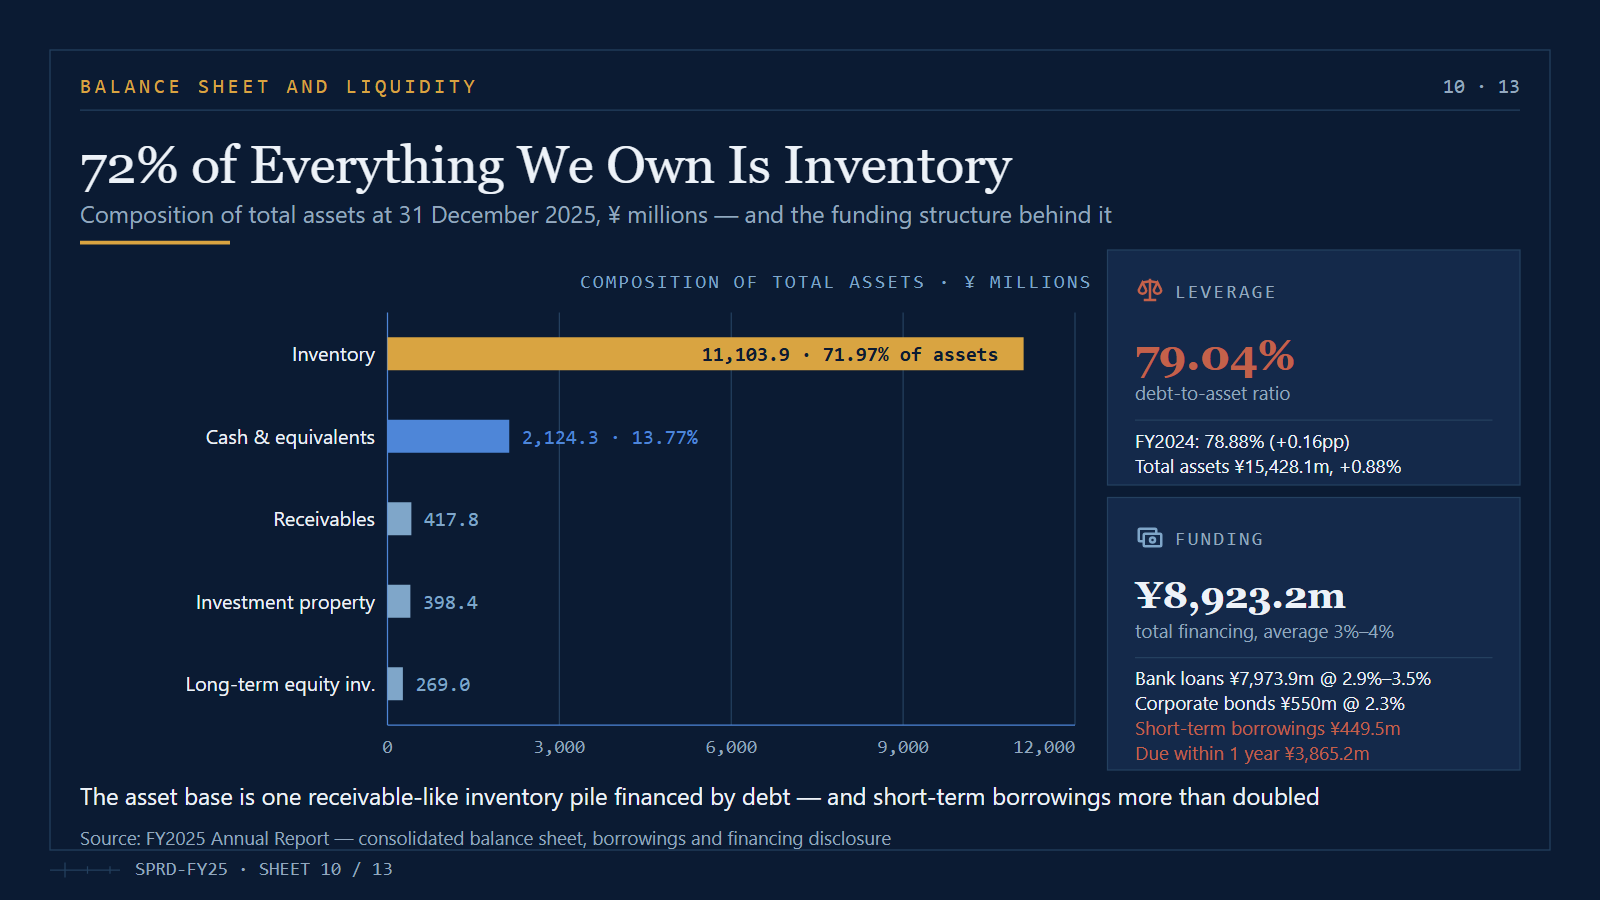
- Balance sheet and liquidity — a horizontal bar of asset composition with a leverage panel (debt-to-asset ratio, total assets) and a funding panel (bank loans, bonds, short-term borrowings, maturities).
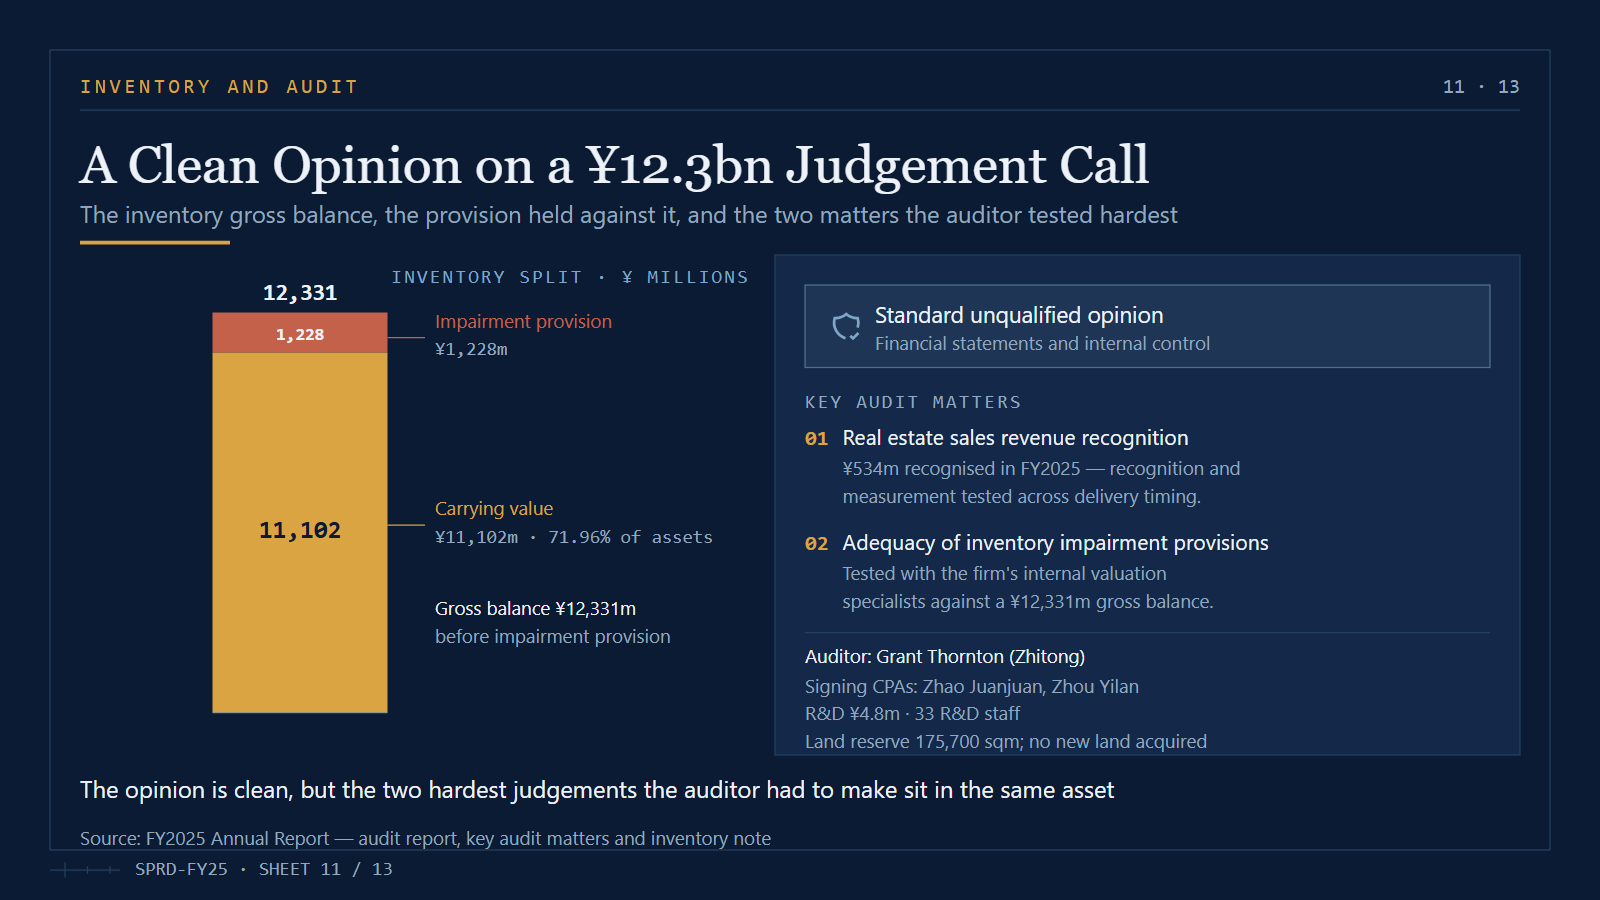
- Inventory and audit — a stacked column splitting gross inventory into carrying value and impairment provision, plus a key-audit-matter panel and an audit-opinion box — a candid asset-quality layout rarely found in templates.
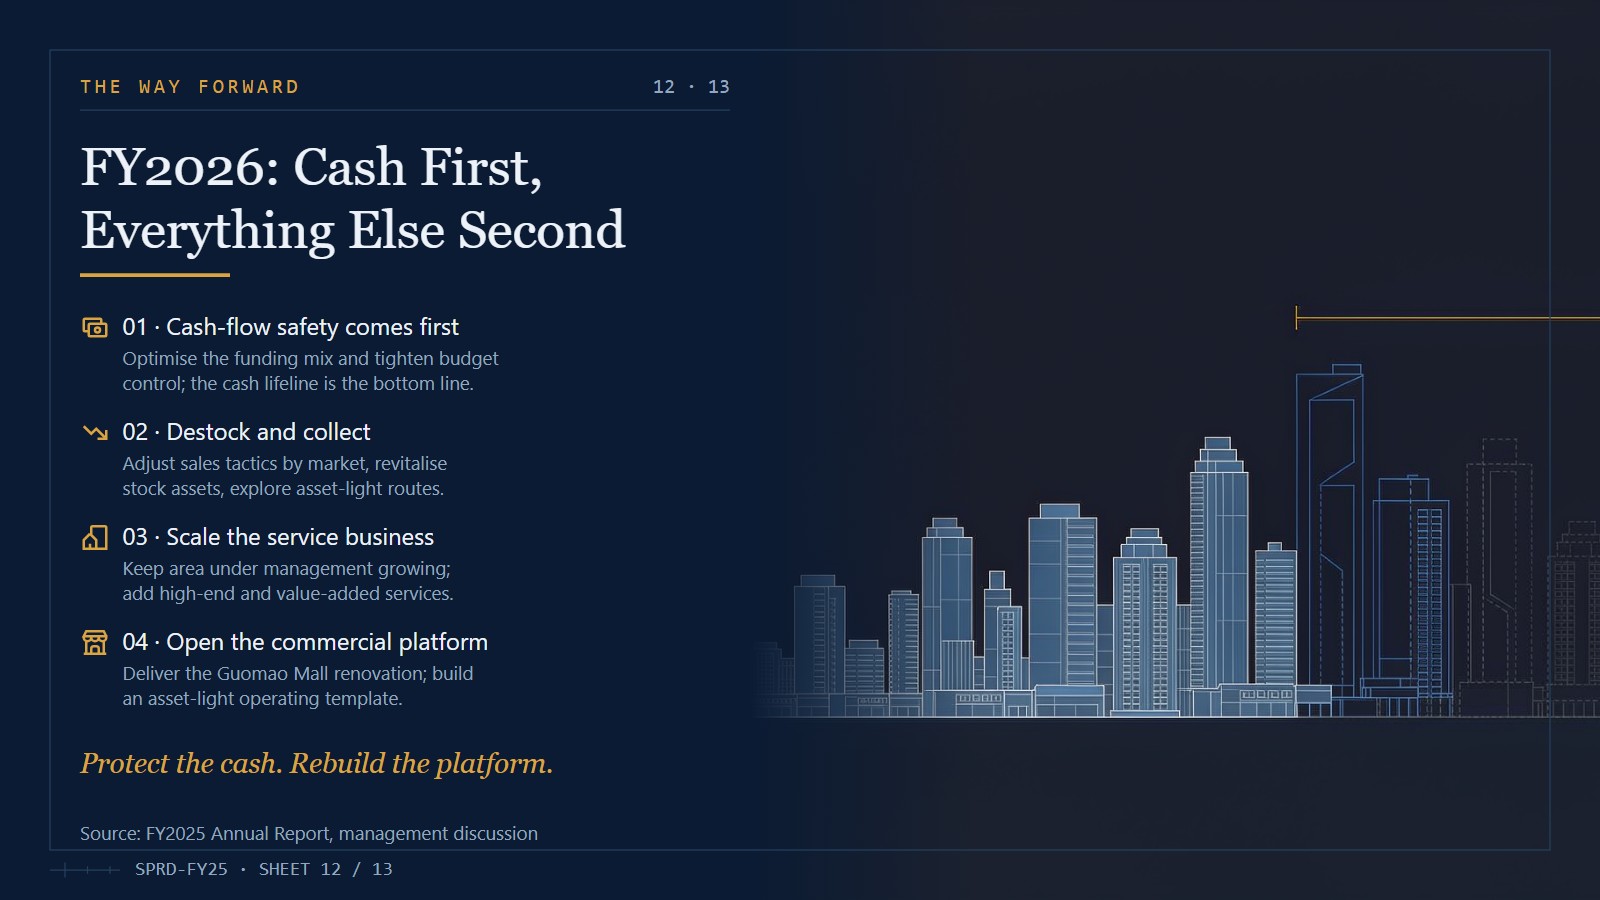
- Outlook slide — four numbered priorities for the coming year over a full-bleed visual, each with a one-line rationale.
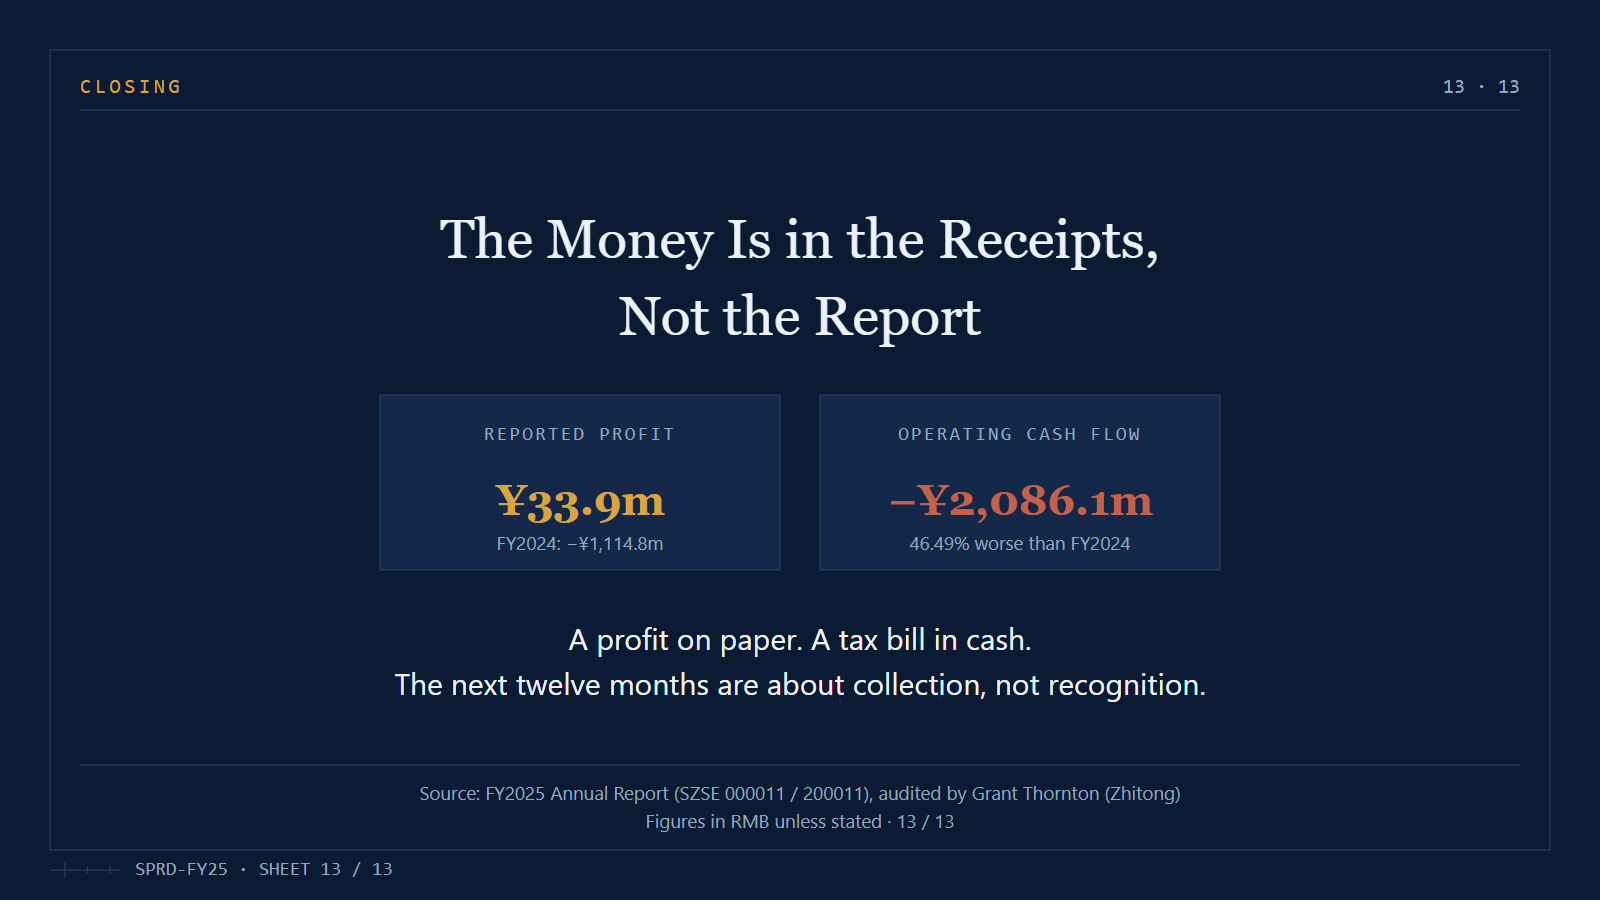
- Closing slide — a single-statement closer carrying the two numbers that frame the year, with source and attribution placeholders.
Included: 10 native, fully editable charts (column, line, doughnut, horizontal bar, stacked column, waterfall); a synchronized vector icon set; a master-consistent dark theme; 16:9 widescreen format; and source-line placeholders on every data slide for citation-ready disclosure.
Who It’s For
- IR, finance, and company-secretary teams at listed property management and development companies presenting results shaped by segment mix, delivery timing, and inventory carrying values.
- State-owned urban operators and city-space platforms that need a credible way to show portfolio scale, area under management, and state shareholding alongside commercial performance.
- CFOs reporting a profit-versus-cash gap — the waterfall and cash-bridge layouts give you a clear, non-defensive way to explain where the money actually went.
- Equity analysts and investment professionals covering real estate, property services, and income-producing assets — the segment-margin, asset-composition, and inventory-provision layouts double as ready-made analytical frames.
- Asset managers and portfolio teams who want to repurpose an annual-results structure for portfolio reviews, asset-level performance packs, or internal strategy updates.
- Designers and agencies serving real estate and property clients who want an architectural dark aesthetic instead of another white corporate template.
- Educators and trainers teaching earnings-quality analysis, cash conversion, or inventory-heavy balance-sheet reading with a realistic, chart-rich case structure.
If your story runs on area under management, segment margins, and inventory that turns slowly, this template gives you the structure, the charts, and the architectural visual language to tell it well — simply replace the numbers and make it yours.
Related Posts

Infrastructure Construction Industry PowerPoint Template

TTET FY2025 Annual Results

TSMC FY2025 Annual Results