Infrastructure Construction Industry PowerPoint Template
September 24, 2026 by Ryan

What It Is
This is a 13-slide, fully editable PowerPoint template designed for infrastructure construction and engineering companies to present annual results, financial reviews, and investor briefings in a clear and professional way.
It is based on the annual results presentation of a construction company, with layouts designed to reflect how infrastructure companies typically present their business and financial performance. The template includes practical slides for segment revenue breakdowns, regional operations, margin analysis, balance sheet highlights, customer concentration, and key priorities for the year ahead.
The deck’s visual identity — “Timberline” — pairs a deep forest-green canvas with warm cream typography and muted gold accents, evoking landscapes, engineering, and grounded credibility. A serif display face (Georgia) carries the headlines, a clean sans-serif handles body text, and a dedicated data face keeps every number crisp and aligned. Two atmospheric, AI-generated landscape visuals bookend the presentation, while the ten slides in between are pure, chart-driven information design.
Everything in the file is native PowerPoint: all ten charts are real, editable chart objects (not flattened images), every icon is a vector shape, and all colors, fonts, and layouts can be restyled in minutes. Whether you are an IR team preparing a results briefing, a consultant building a sector review, or a designer assembling a client report, you can swap in your own figures, retitle the sections, and be presentation-ready the same day.
What’s Inside
The 13 slides follow a proven four-part narrative arc — Results → Performance → Pressure Points → Path Forward — that works for any engineering or construction business:
- Cover slide — a full-bleed twilight landscape with a headline, ticker/company line, and three KPI callouts (revenue, profit, audit/assurance status) set directly over the image.
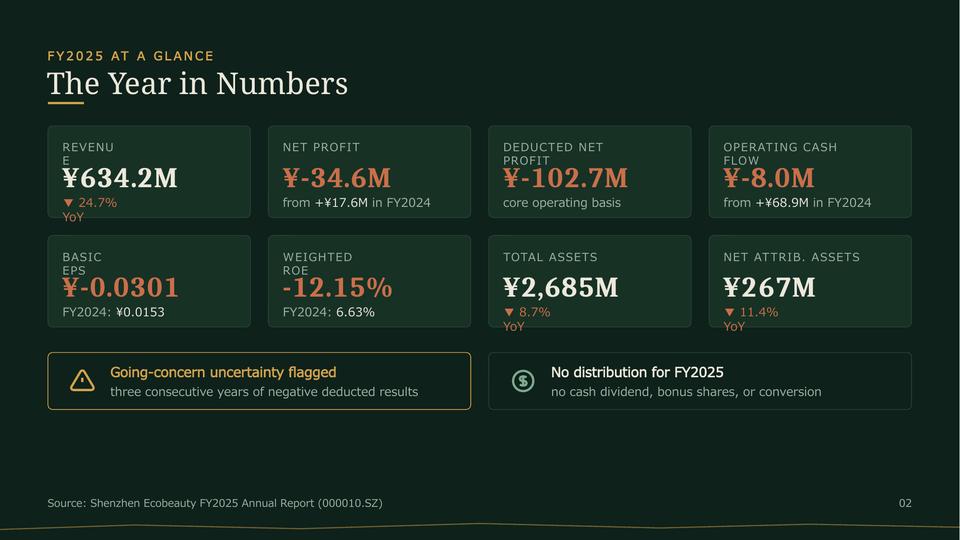
- Year at a Glance — an eight-metric scorecard grid: revenue, net profit, core (deducted) profit, operating cash flow, debt ratios, and more, each with year-over-year deltas.
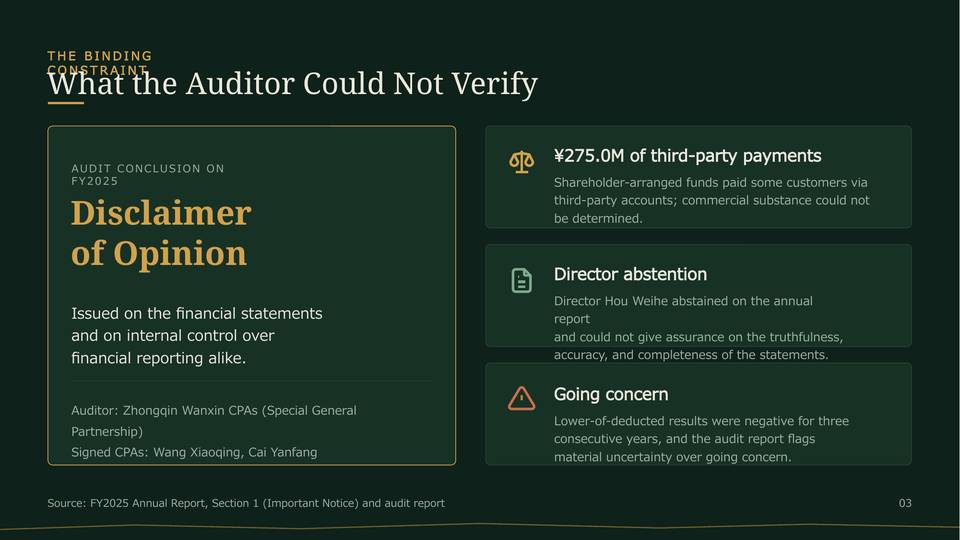
- Risk & Assurance slide — a structured three-panel layout for audit conclusions, material uncertainty, and key matters — ideal for candid risk communication.
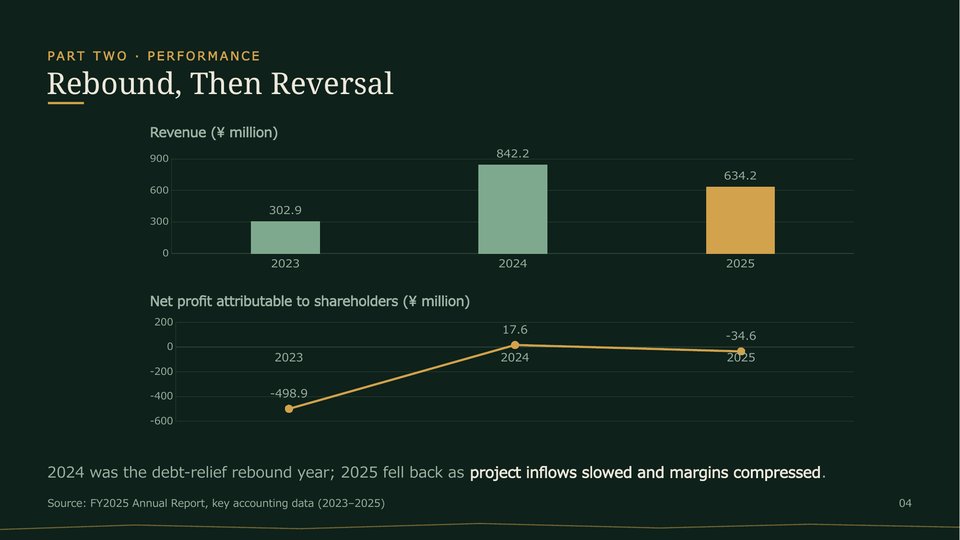
- Multi-year performance — paired column and line charts showing revenue trajectory and profit trend across three fiscal years.
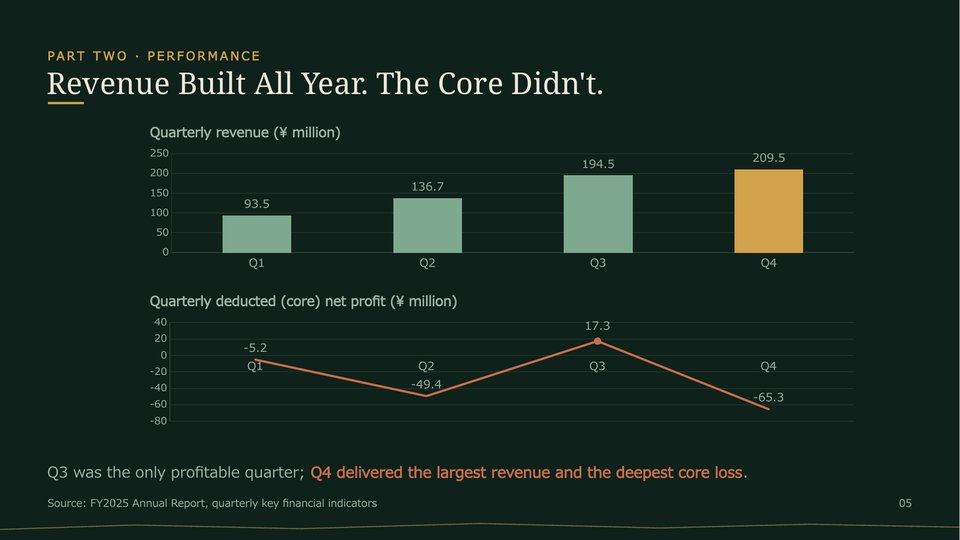
- Quarterly analysis — column and line combo pages breaking the year into quarters, perfect for showing seasonality in project delivery and cash generation.
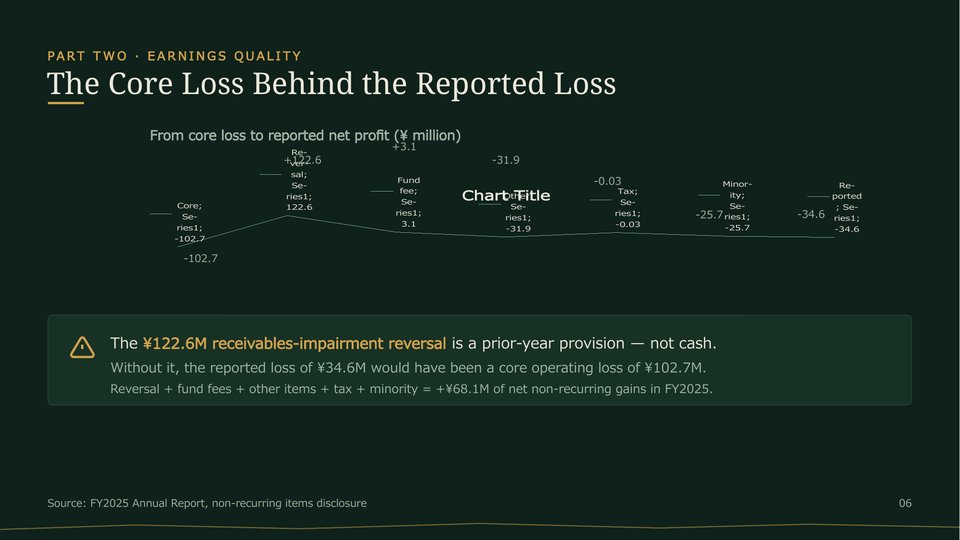
- Earnings-quality bridge — a waterfall chart that walks from core operating loss to reported net profit, exposing one-off items visually.
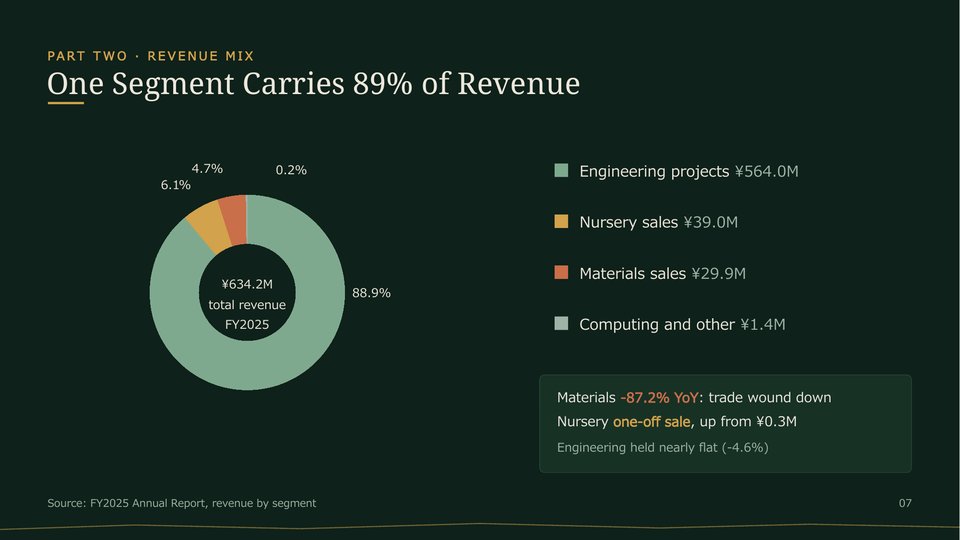
- Revenue mix — a donut chart with a companion data panel, showing segment concentration at a glance.
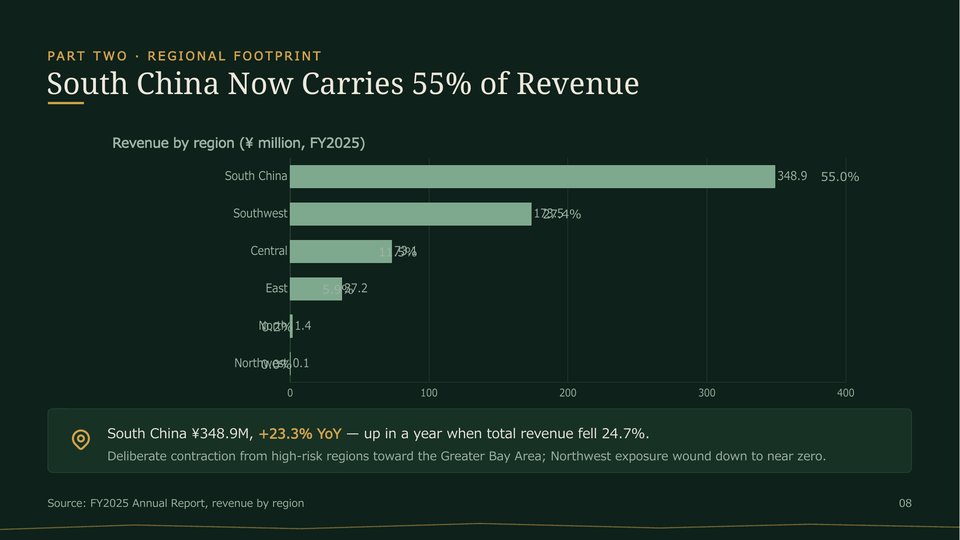
- Regional footprint — a horizontal bar chart ranking revenue by geography, with an insight banner for strategic commentary.
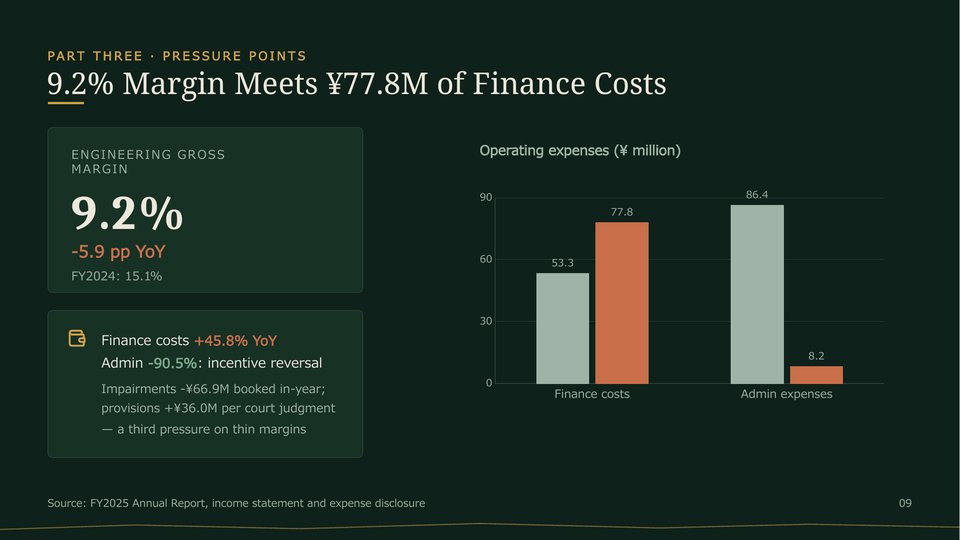
- Margin & cost pressure — a KPI tile plus grouped column chart comparing operating expenses year over year.
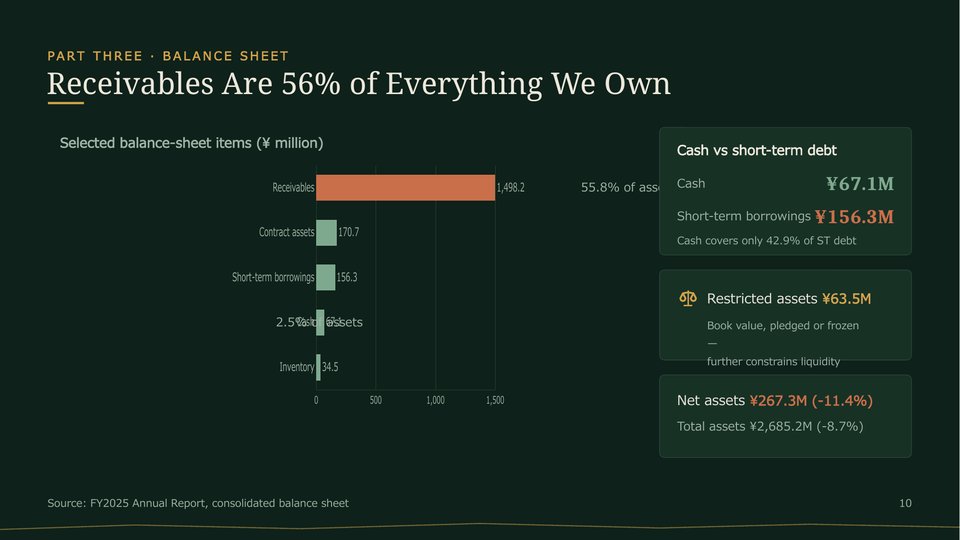
- Balance-sheet slide — horizontal bar chart of major balance-sheet items, plus callout panels for liquidity, restricted assets, and net assets.
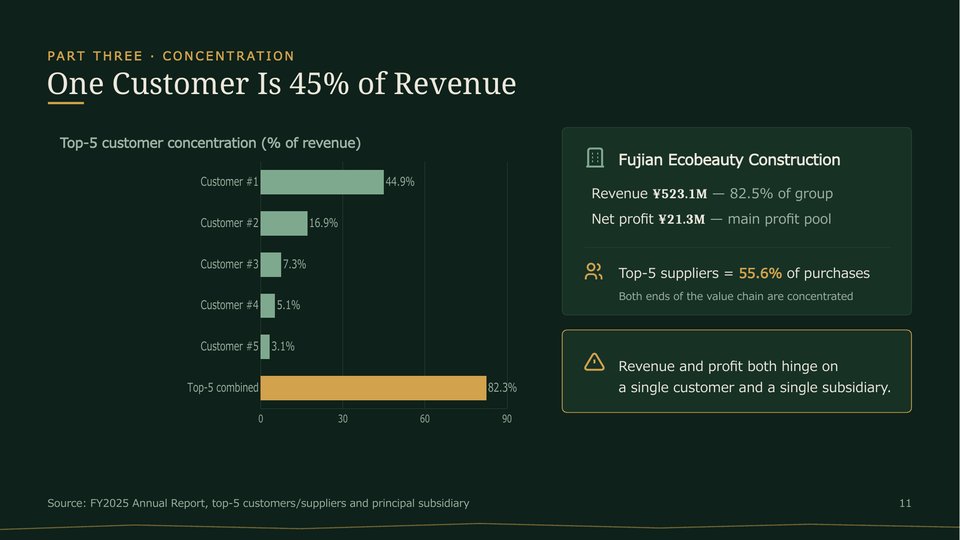
- Concentration analysis — customer concentration bar chart with a subsidiary spotlight panel.
- Forward outlook — a four-priority roadmap beside a closing landscape image and an inspirational sign-off line.
- Thank-you closer with source attribution.
Included: 10 native, fully editable charts (column, line, waterfall, donut, horizontal bar); 16 synchronized vector icons; 2 high-resolution landscape visuals; master-consistent dark theme; 16:9 widescreen format; source-line placeholders on every data slide for audit-friendly citation.
Who It’s For
- IR & finance teams at construction, engineering, and infrastructure firms who need an annual-results or interim-results deck that speaks the industry’s language — backlog, receivables, margins, regional mix — without starting from a blank slide.
- Listed-company secretaries and disclosure specialists preparing investor briefings, results roadshows, or regulatory-adjacent presentations where clear data visualization and honest risk disclosure matter.
- Consultants, analysts, and investment professionals producing sector reviews, due-diligence readouts, or credit and equity research presentations on construction and infrastructure names.
- Designers and agencies serving built-environment clients who want a distinctive, non-generic template — the earthy forest palette reads “landscape and land works,” a refreshing contrast to the usual corporate blue.
- Educators and trainers teaching financial storytelling, turnaround analysis, or earnings-quality concepts with a realistic, chart-rich case structure.
If your story involves heavy assets, thin margins, project-driven revenue, and a need to build (or rebuild) credibility with investors, this template gives you the structure, the charts, and the visual authority to tell it well.


Related Posts

Property Management and Real Estate PowerPoint Template

TTET FY2025 Annual Results

TSMC FY2025 Annual Results